
2 - Competition Techniques

The competition clock has not started yet, so this is the right moment to slow down. Put the algorithm list aside; today we are going to rehearse the decisions that prevent a team from losing ten hours before the real modeling has even begun.
The first blog was about the discipline of turning reality into a model. This one is about what happens when the clock starts. A competition gives you several unfamiliar problems, a small team, incomplete information, and a deadline. The temptation is to hunt immediately for an impressive algorithm. Resist it. Most teams do not lose because they never heard of a sufficiently advanced method; they lose time because they choose a problem for the wrong reason, build modules in the wrong order, cannot reproduce one another’s work, or use tools without deciding what each tool is responsible for.
This blog is therefore not a catalogue of tricks. It is an operating manual. We will compare the problem families in CUMCM and MCM/ICM, design the first ninety minutes, build a reproducible toolchain, and turn daily preparation into three habits: reading strong papers, reconstructing effective visualizations, and extending algorithms beyond what I can cover here. The final part is a detailed guide to ChatGPT. AI can be a tireless sparring partner, but it cannot become the unnamed author of your evidence, your citations, or your judgment.
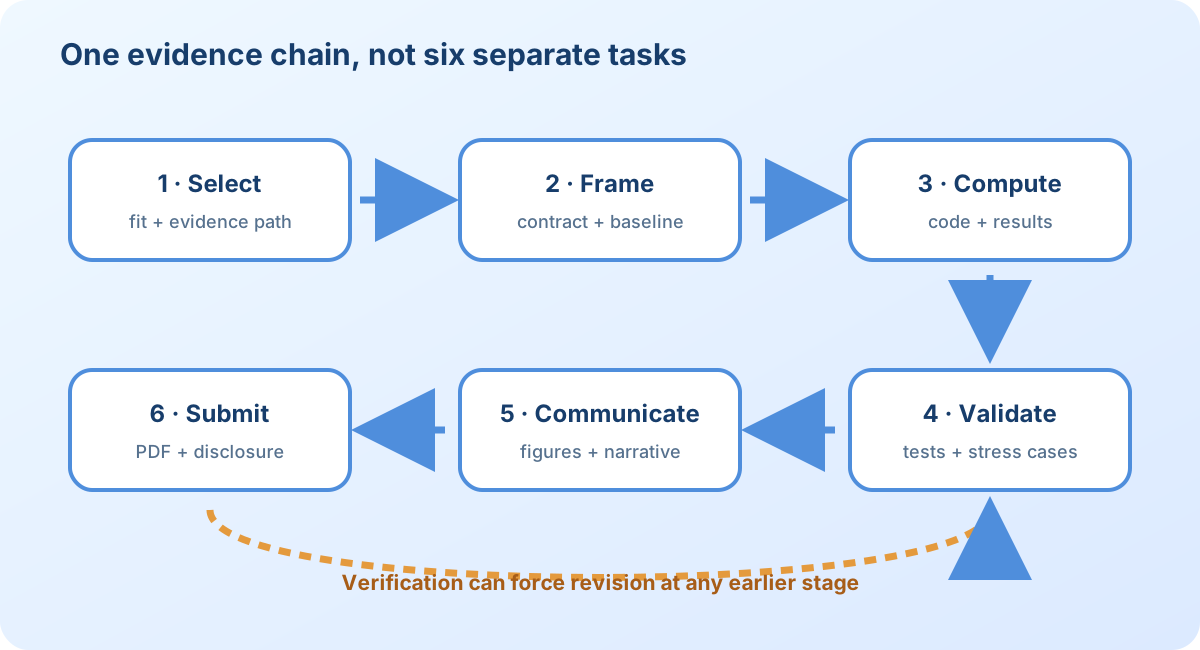
Competition Formats and Problem Selection
CUMCM and MCM/ICM are not the same contest translated into two languages. CUMCM is organized by the Chinese Society for Industrial and Applied Mathematics. Its official charter describes problems simplified from science, engineering, humanities, social science, economics, and management; teams should be able to work from ordinary university mathematics rather than specialized prior knowledge. MCM/ICM is organized by COMAP, and a team chooses one of six named problem families. The format, language, timetable, report rules, and award structure differ, so check the current official instructions rather than inheriting last year’s checklist from a senior student.
Problem selection should begin with fit, not fear. For every candidate problem, ask five questions:
- Can we restate the decision or prediction in two sentences?
- Do we understand the units, data, and major constraints well enough to build a baseline today?
- Does at least one teammate recognize a useful mechanism, not merely an algorithm name?
- Can we imagine two or three figures that would make the final argument visible?
- Is there a credible path from the first subproblem to the last, or do later tasks depend on evidence we cannot obtain?
A problem full of familiar vocabulary can still be a poor choice if the final task asks for a policy argument your team cannot support. An unfamiliar context can be a good choice if the mathematical structure is clear and the data are usable. Spend enough time to compare complete problem chains, but set a decision deadline. Endless selection is itself a decision: it chooses to leave less time for modeling.
CUMCM Problem Ecology
The official CUMCM archive is the source of truth about what was actually asked. Recent competitions may include several lettered problems; the letters are identifiers, not permanent guarantees that a certain algorithm will appear. Informal advice such as “A is physical, B is optimization, C is data” can help you scan older papers, but it must never replace reading the current prompt. The organizers explicitly describe the source of problems broadly, and recent official review activities discuss A through E. Treat every year’s set as new.
Still, historical structures are useful. Engineering and physical-system prompts often ask you to convert geometry, force, heat, flow, or motion into state equations, then calibrate unknown parameters and design an operating strategy. Their danger is false precision: a beautiful differential equation is not persuasive if the boundary conditions or units are invented. Begin with a diagram, a conservation statement, and one hand-checkable limiting case.
Operations and decision prompts often combine allocation, scheduling, routing, evaluation, and sensitivity. Their danger is premature optimization. Before choosing a solver, separate variables you control from observations you merely estimate. Write the objective in plain language and list hard constraints. If two objectives conflict, do not hide one in an arbitrary weight without explaining how the weight affects the recommendation.
Data-oriented prompts often contain spreadsheets, images, time series, or multiple tables whose definitions do not line up neatly. Their danger is treating cleaning as clerical work. Missingness, duplicate entities, inconsistent time zones, target leakage, and changing measurement rules can determine the answer before any model is fitted. Create a data dictionary and a row-count audit; preserve the raw files; make every transformation reproducible.
Evaluation and policy prompts ask you to construct indicators, rankings, or recommendations for stakeholders. Their danger is confusing a score with truth. Explain why each indicator belongs, how scales are normalized, how weights are chosen, and whether modest changes reverse the ranking. A recommendation should identify who can act, what they should do, and what evidence would trigger revision.
The practical lesson is simple: do not choose CUMCM Problem A because you are “the differential-equation team,” or Problem C because you know machine learning. First identify the actual mechanism and evidence path. Then ask whether your team can complete a modest version of that path under the deadline.
MCM/ICM Problem Families
COMAP currently describes six families: MCM A, continuous; MCM B, discrete; MCM C, data insights; ICM D, operations research/network science; ICM E, sustainability; and ICM F, policy. A team chooses one problem. These labels are more explicit than the folk categories used for CUMCM, but they are still starting points rather than recipes.
MCM A: Continuous Models
Continuous problems often involve quantities that vary over time or space: temperature, energy, population, fluid flow, wear, or physical motion. Differential equations, difference equations, simulation, parameter estimation, and sensitivity analysis are common tools. Start by naming the state and writing what changes it. Check units before solving. A numerical curve is not evidence until you compare it with a limiting case, observed value, or alternative baseline.
MCM B: Discrete Models
Discrete problems often center on arrangements, routes, schedules, geometry, or combinatorial decisions. Graphs, integer programming, dynamic programming, heuristics, and simulation may appear. The central question is not “which search algorithm is strongest?” but “what makes a candidate feasible, and what quantity distinguishes a useful solution?” Build a tiny instance whose optimum you can reason about by hand before trusting a large search.
MCM C: Data Insights
Problem C usually makes the dataset part of the problem rather than background decoration. The workflow includes inspection, cleaning, feature design, exploratory visualization, modeling, validation, and interpretation. A high predictive score is not enough if the feature would be unavailable at decision time. Use a defensible train/test split, compare with a simple baseline, and connect each visualization to a claim.
ICM D: Operations Research and Network Science
Problem D often concerns connected systems: transportation, communication, supply, influence, sports, or infrastructure. Nodes and edges are useful only after their meanings are declared. Explain whether an edge records distance, cost, capacity, similarity, or probability. Network centrality can describe structure, but it does not automatically identify the best intervention. Couple the network metric to the stakeholder’s decision.
ICM E: Sustainability
Sustainability problems require more than adding an environmental term to a cost function. They usually combine physical limits, human behavior, long time horizons, uncertainty, and several stakeholders. Define the system boundary carefully: shifting emissions, risk, or resource use outside the boundary is not genuine improvement. Report trade-offs instead of compressing every concern into one opaque score.
ICM F: Policy
Policy problems ask for recommendations in a world where values, incentives, uncertainty, and implementation matter. Quantitative evidence should clarify consequences, not pretend to eliminate judgment. Distinguish observation from assumption, prediction from preference, and a scenario from a forecast. A strong policy paper names affected groups, implementation steps, possible unintended effects, and a monitoring plan.
Worked selection example: three problems, one team
Imagine that your team finds three plausible choices. Problem A describes an ecological population whose sex ratio changes with environmental conditions. Problem C provides a large transaction table and asks for patterns and forecasts. Problem F asks for a policy that balances access, cost, and fairness. One teammate knows differential equations, another writes reliable Python, and the third writes clearly.
The beginner’s vote is often “choose C because it has data” or “choose A because equations look impressive.” A better comparison gives every problem four entries: one candidate decision, one baseline, one validation route, and one likely bottleneck. For A, these might be an intervention threshold, a two-stage population baseline, equilibrium checks, and parameter identification. For C: inventory allocation, a seasonal-naive forecast, blocked time-series testing, and leakage. For F: a phased allocation rule, equal-per-capita allocation, subgroup scenario analysis, and unsupported causal assumptions.
Now the trade-off is visible. If no one can explain how A’s parameters could be identified, elegant ODEs will not rescue it. If C has abundant data but no decision, the team may produce twenty charts without answering the question. If F admits a transparent trade-off model, good writing becomes an analytical advantage. Selection is not about finding the safest letter. It is about exposing the work you will actually have to finish.
Real case: 2024 MCM Problem A and the lamprey ecosystem
The 2024 MCM Problem A asked teams to study how a sea-lamprey population and its ecosystem may change when larval sex ratios respond to food availability. COMAP’s Outstanding papers used different architectures—stage-structured dynamics, resource feedback, stability analysis, and scenario comparison—but they all had to turn the same biological story into testable modules.
A minimal state might be
while a bounded response connects resources to the female share,
The mechanism is now inspectable: resources change
Each figure should test a different claim. A time-series panel compares abundance under fixed and adaptive sex ratios. A phase portrait shows whether the system returns to equilibrium. A sensitivity plot reveals whether conclusions depend mostly on maturation, fecundity, or the response slope
Real case: 2024 CUMCM crop planning
The 2024 CUMCM C problem asked for multi-year planting decisions across plots, greenhouse types, seasons, and crops. Public excellent papers add heuristics, uncertainty, CVaR, correlation, and heatmaps. The essential competition skill comes earlier: preserve time order while translating agricultural rules.
Let
The large index set may tempt a team to assume that only a genetic algorithm is possible. In fact, much of the model is a mixed-integer linear program. Build a reduced exact version with two years, several plots, and a few crops before committing to a heuristic. Enumerate the tiny instance by hand, then implement it. A mismatch usually reveals an incorrect time index, a missing compatibility rule, revenue counted beyond demand, or a binary variable not linked to planting area. This reconstruction teaches more than collecting ten algorithm names, because it creates an auditable ground truth for the full solver.
The 2026 official problem set illustrates the breadth: smartphone battery drain, a moon-colony space-elevator system, data about stars, sports management, passive solar shading, and generative-AI education policy. That variety is exactly why memorizing one algorithm per letter is fragile. Read the current problem, then choose the mathematical language.
The First Ninety Minutes
Give each candidate problem the same short diagnostic rather than letting one teammate sell a favorite title. Read the full prompt once without solving. On the second pass, mark verbs such as predict, design, rank, explain, and recommend; quantities with units; hard constraints; uncertain phrases; and required deliverables. On the third pass, draw dependencies among subproblems.
Then build a one-page selection sheet. Include the decision, available data, likely state variables, a baseline method, the hardest uncertainty, one validation idea, and three possible figures. Score confidence honestly. “We know XGBoost” is not a validation idea. “We can hold out the final month and compare against a seasonal mean” is.
Once selected, create the smallest complete chain. Restate the problem. Define variables and assumptions. Produce one baseline. Generate one result. Check it. Write one paragraph interpreting it. A rough end-to-end chain tells you where the real bottleneck lies. If you spend twelve hours perfecting a forecast before discovering the optimizer needs a probability distribution rather than a point estimate, the modules were built in the wrong order.
Use input–output contracts at every handoff. A demand module accepts historical arrivals and calendar variables, and returns a distribution by hour. A simulation accepts that distribution, service-time data, and a staffing plan, and returns waits. An optimizer accepts waits, labor rules, and costs, and returns feasible schedules. Every arrow states units, shape, timing, and uncertainty. This makes both mathematics and teamwork debuggable.
Imagine that your team has three candidate prompts. The first asks for a physical model of battery temperature and energy consumption. The second asks for a route and facility plan on a network. The third provides a large table of event records and asks for prediction plus a recommendation. One teammate has studied differential equations, one writes reliable Python, and one is a strong editor but none has serious graph-optimization experience.
The wrong selection meeting sounds like this: “Battery equations look scary; networks always have standard algorithms; data means we can use machine learning.” Each sentence substitutes a stereotype for a reading. Instead, spend twenty minutes per prompt and produce the same evidence sheet.
For the battery problem, the team identifies charge level and temperature as states, usage and environment as inputs, a recurrence as a baseline, held-out discharge curves as evidence, and a design recommendation as the final output. The differential equations are unfamiliar, but the measurements and validation path are clear. For the network problem, the team can draw nodes and edges but cannot decide whether edge weights mean distance, cost, time, or reliability; later tasks require a resilience argument. The method name is familiar, but the decision contract is not. For the data problem, the table is large, yet the target definition changes across years and some columns may reveal the future. The coding is familiar, but leakage could invalidate the whole result.
Now score each candidate from one to five on problem clarity, data usability, baseline feasibility, validation, writing fit, and extension potential. Do not add the scores mechanically and obey the largest number. Discuss the weakest essential dimension. A problem with excellent extension potential but no credible validation is dangerous. A problem with a simple baseline, clear evidence, and one meaningful extension may be ideal even if it looks less glamorous.
Suppose the battery prompt wins. The first ninety minutes should end with artifacts, not enthusiasm. The team writes the state update in words, draws the energy boundary, creates a table of variables and units, plots one provided discharge curve, and writes a two-paragraph report skeleton. The Python teammate prepares data loading and a constant-rate baseline. The differential-equation teammate derives the simplest recurrence and checks a limiting case. The editor verifies that the baseline actually answers the first requested task and begins the source log. At the next check-in, each person brings an output that another person can inspect.
What if two candidates remain tied? Run a baseline sprint. Give each thirty minutes. For one, calculate a tiny physical example; for the other, create a four-node network and express the constraints. Try writing a result paragraph for both. The sprint reveals hidden difficulty more reliably than another abstract debate. Then choose and stop reopening the decision unless genuinely new evidence appears.
Once selected, make a risk register with three columns: failure, early warning, and response. “Thermal parameter cannot be estimated” might have the warning “different parameter sets fit equally well” and the response “report an identifiable range and test recommendation sensitivity.” “Dataset leaks target” might have the warning “near-perfect validation score from a post-event feature” and the response “audit feature availability at prediction time.” Risks become manageable when attached to observations and actions.
The ninety-minute framework is not sacred. A short contest or a very large problem set may require another schedule. Its purpose is to stop three common losses: choosing by title, coding before defining outputs, and splitting tasks before dependencies are understood. If your team already has a better practiced ritual, use it. The standard is whether it produces a defensible first chain quickly.
A Reproducible Competition Toolchain
Tools should have separate jobs. When every idea, dataset, calculation, and paragraph lives in one giant notebook, nobody knows which result is current. The following stack is one practical option; equivalents are fine if the team practices them in advance.
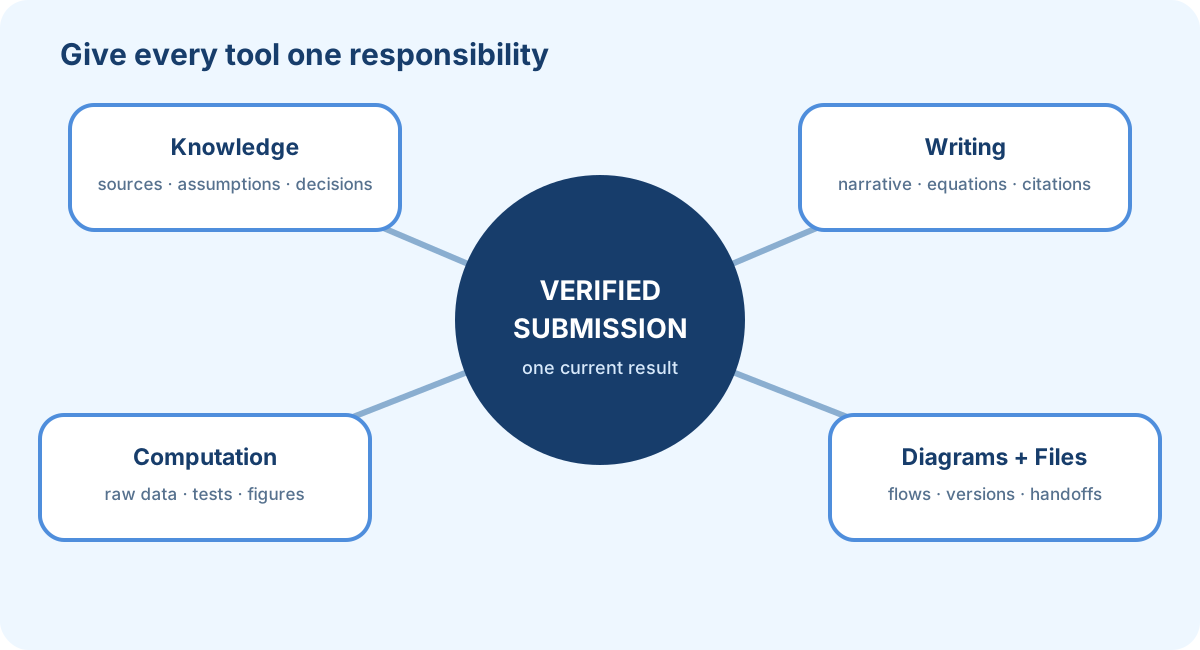
Notion: A Shared Knowledge Base
Use Notion for material that should survive beyond one report: paper notes, model cards, useful figures, algorithm summaries, mistakes, and questions. Create a database with fields for topic, source, assumptions, inputs, outputs, validation, code link, and confidence. When you finish this blog, save the idea that mattered to you and write one sentence about what remains unclear. Shared notes let teammates learn from one another before the contest begins.
During a competition, create a compact page with the problem restatement, task graph, decision log, data dictionary, assumption ledger, and responsibilities. Do not paste final equations into five places. Link to the canonical code or writing section. A shared notebook is valuable because it reduces forgotten context, not because it looks organized.
A useful setup takes fifteen minutes. Make one top-level page for the project and six linked views: Inbox, Sources, Model Cards, Decisions, Figures, and Tasks. Inbox is deliberately messy; it catches a thought before it disappears. Sources stores the original link, access date, relevant quotation in your own notes, and which claim may use it. A model card records purpose, inputs, outputs, assumptions, validation, failure modes, and code location. Decisions records choices that teammates might otherwise reopen every hour. Figures stores a thumbnail, its claim, underlying script, and current status. Tasks contains an owner and a deliverable—not “work on model,” but “compare the capacity baseline with the queue simulation on Tuesday data.”
Do not confuse a database with understanding. At the end of each work block, empty Inbox: connect the note to a model or source, turn it into a task, or delete it. Add a short “why this changed” line to important decisions. If the team switches from mean wait to 90th-percentile wait, the record should say what stakeholder need or observation justified the change. This small habit prevents the report and code from silently optimizing different objectives.
Collaborative Documents: Write While You Model
Open a shared document early. Add the problem restatement, variable table, provisional section headings, and blank figure slots. Writing reveals missing logic: if you cannot finish the sentence “we minimize ___ because ___,” your objective is not ready. Assign section owners but let one editor maintain notation and narrative consistency.
Use comments for questions, not parallel rewrites. Resolve a comment only after the decision is recorded. Near the deadline, freeze structure and edit for clarity, cross-references, units, and claims. A paper assembled from three independent mini-reports usually repeats definitions and contradicts itself.
Start with a paragraph budget. The introduction needs the decision and contribution, not a history of the entire industry. The model section needs assumptions immediately before the equations they support. The results section should follow the same order as the questions. Give every important figure a placeholder caption before the figure exists: “Figure 4 will compare observed and predicted peak wait on held-out days.” If you cannot write that sentence, the planned figure may have no job.
Use one notation sheet at the top of the document. When a teammate introduces
Python and Jupyter: Reproducible Computation
Keep raw data immutable. Put cleaning, modeling, evaluation, and figure generation into functions or scripts that can run from a fresh environment. Use a notebook for exploration, but move stable logic into modules. Fix random seeds where appropriate and record package versions. Save generated tables and figures with descriptive names rather than final2_reallyfinal.png.
Every model needs a tiny test. For a routing algorithm, use four nodes with an obvious shortest path. For a recurrence, verify the first two steps by hand. For an optimizer, construct one feasible and one infeasible decision and check the constraints. Print dimensions, units, missing counts, and objective components. These tests are faster than debugging a polished but impossible answer.
Use a simple project layout: data/raw, data/processed, src, notebooks, figures, tables, and tests. A single command or top-level script should rebuild processed data and paper assets. Put configuration—file paths, seeds, scenario parameters, and output directory—in one place. Do not hide essential preprocessing in a notebook cell that was run three hours ago and then edited.
Exploration and production have different needs. In a notebook, inspect distributions, try transformations, and make quick plots. Once a step matters to the result, move it into a named function with a docstring and a test. Restart the kernel and run from top to bottom. If the notebook fails after restart, it depends on invisible state. Export a clean environment file and ask a teammate to run the pipeline. “It works on my laptop” is not reproduction.
LaTeX and Overleaf: Technical Typesetting
Prepare a minimal report before competition day. Confirm page size, fonts, margins, bibliography, figure placement, and PDF export. Define notation once and use labels for equations, figures, and tables. Keep each figure caption self-contained: it should state what is shown, under which scenario, and what conclusion the reader should notice.
Compilation is part of verification. Missing references, clipped figures, broken symbols, and unreadable labels are evidence that the final artifact has not been checked. One teammate should perform a clean compile and inspect the PDF page by page on another device.
Create commands or buttons for three checks: a normal compile, a clean compile that removes auxiliary files, and a final PDF inspection. Keep figure files in a dedicated directory and never paste screenshots of equations. Use vector PDF/SVG for diagrams and high-resolution raster files only when the source is raster. Set figure widths relative to the text width, then open the PDF at 100%: labels that require zooming are too small.
Bibliography entries deserve the same care as equations. Import them from the publisher or DOI record, then verify authors, title, year, and URL. Cite a source at the sentence it supports. A bibliography with twenty items at the end does not show which claim came from which source. Before submission, click links and search the PDF for unresolved ?? references.
draw.io or PowerPoint: Structural Diagrams
Use diagrams to expose dependencies, boundaries, networks, and decision flows. A box should name a real object or computation; an arrow should name what is transferred. Avoid decorative arrows that could point either way without changing the meaning. Export vector graphics when possible, use a consistent typeface, and verify readability at the size used in the paper.
Begin with black-and-white structure. Put the real system on the left, the mathematical representation in the center, and the decision or evidence on the right. Align objects, keep arrows from crossing, and use shape consistently: perhaps rounded rectangles for processes, cylinders for data, and diamonds for decisions. Add color last, with one meaning per color. If blue sometimes means “observed” and elsewhere means “optimized,” the style is decoration rather than language.
PowerPoint is often faster for free-form layouts; draw.io is often better for connected graphs and reusable components. Either can produce excellent figures. The test is whether a reader can answer three questions in ten seconds: Where does information enter? What transforms it? Which output supports the conclusion?
File and Version Discipline
Whether you use Git, cloud storage, or both, agree on one canonical folder and naming scheme. Preserve raw data, separate generated output, and record the command that recreates each result. Commit or snapshot at meaningful milestones. Never overwrite the only working version an hour before submission. A reproducible folder is a quiet form of insurance.
Use filenames that survive stress: arrival_cleaning.py, scenario_peak20.csv, and fig_wait_comparison.pdf are better than new.py, data2.csv, and 图3最新版final.png. Add a short README containing the run order and the owner of each module. If Git is unfamiliar, practice branches and conflict resolution before the contest; competition day is not the time to discover how merging works. If you use OneDrive or another synchronized folder, avoid editing the same binary file simultaneously and keep periodic immutable snapshots.
Learning from Award-Winning Papers
One person learning alone cannot invent, in a few months, every useful modeling pattern discovered by hundreds of strong teams. Reading excellent papers is a way to study with those teams after the competition is over. You are not copying their wording or pretending their method is yours. You are learning how experienced modelers connect questions, assumptions, calculations, figures, and conclusions.
Read in three passes. First, recover the architecture: what did the paper answer, what modules did it build, and what did each module pass to the next? Second, trace one important claim backward from the abstract to a figure, then to a calculation, then to data and assumptions. Third, reproduce one small result. If the data are unavailable, reconstruct a toy version and label it honestly.
Build a paper card in Notion. Record the problem, decision, model family, strongest assumption, best figure, validation strategy, one limitation, and one transferable technique. Do not write “uses neural network.” Write what the network consumed, what it predicted, how it was tested, and why that output mattered downstream. Over time, these cards become your personal library of modeling moves.
Compare several papers for the same problem. One paper may be mathematically ambitious but weakly validated; another may use a simple model and communicate exceptionally well. Ask which evidence changed your belief. Awards can guide your reading list, but they do not make every paragraph perfect. Read actively.
Here is a concrete reading session. Suppose three papers address emergency supply distribution after a storm. Paper A uses a sophisticated multi-objective evolutionary algorithm, Paper B uses a transparent mixed-integer program, and Paper C combines a simple priority score with a simulation. Do not begin by ranking the algorithm names. First write the decision each paper makes: where supplies start, which locations receive them, when vehicles move, and what “fair” means.
Next reconstruct the boundary. Does a vehicle disappear from the model after delivery, or can it reload? Are damaged roads fixed or changing? Does unmet demand carry to the next period? Does the fairness term compare absolute deliveries, fractions of need, or worst-case delay? Two papers may appear to solve the same prompt while answering different operational questions.
Choose one claim from each abstract. If Paper A says it “balances efficiency and equity,” find the Pareto plot and identify the axes. If Paper B says its plan is robust, find the uncertainty set and stress results. If Paper C says simulation confirms effectiveness, find the baseline, replications, and variability. Record whether the claim is directly supported, indirectly suggested, or unsupported. This simple label trains you to separate confident writing from evidence.
Then reproduce one modest component. Recreate Paper A’s trade-off plot from a few reported points, implement Paper B’s smallest network, or rerun Paper C’s priority score on six fictional locations. Your output will be small, and that is the point. You are discovering the meaning of the method without pretending to reproduce unavailable data. Write down every ambiguity you encounter; undocumented choices often teach more than the final curve.
Finally, transfer rather than copy. Change one assumption: allow a road to reopen, give remote locations a minimum service requirement, or make demand uncertain. Predict which recommendation will move before running anything. Your Notion card should end with “I would use this technique when…” and “I would not trust it when…”. Those two sentences are more useful in a future contest than five pages of copied derivation.
Reconstructing Visual Evidence
Let me use a deliberately ordinary analogy. Suppose I ask you to invent, from nothing, the face you consider most beautiful. That is surprisingly hard. You may know a few adjectives, but the whole image remains vague. Yet when you walk down a street or watch a film, you usually have an immediate sense of which faces you find attractive. Years of seeing people have trained your visual judgment. After enough observation, you can even describe recurring features of your own taste.
Visualization develops in a similar way. If you have seen only default spreadsheet charts, “make a beautiful and convincing figure” is an empty instruction. After studying many strong figures, you begin to feel when a chart is crowded, when color is doing useful work, when an axis is hiding the comparison, and when a caption tells you exactly what to notice. Taste is not magic. It is compressed experience.
The analogy has a limit: a scientific figure is not judged only by beauty. It must be truthful, legible, and attached to a claim. A visually dramatic chart that truncates an axis or mixes incomparable groups is worse than a plain honest plot. The goal is evidence with form.
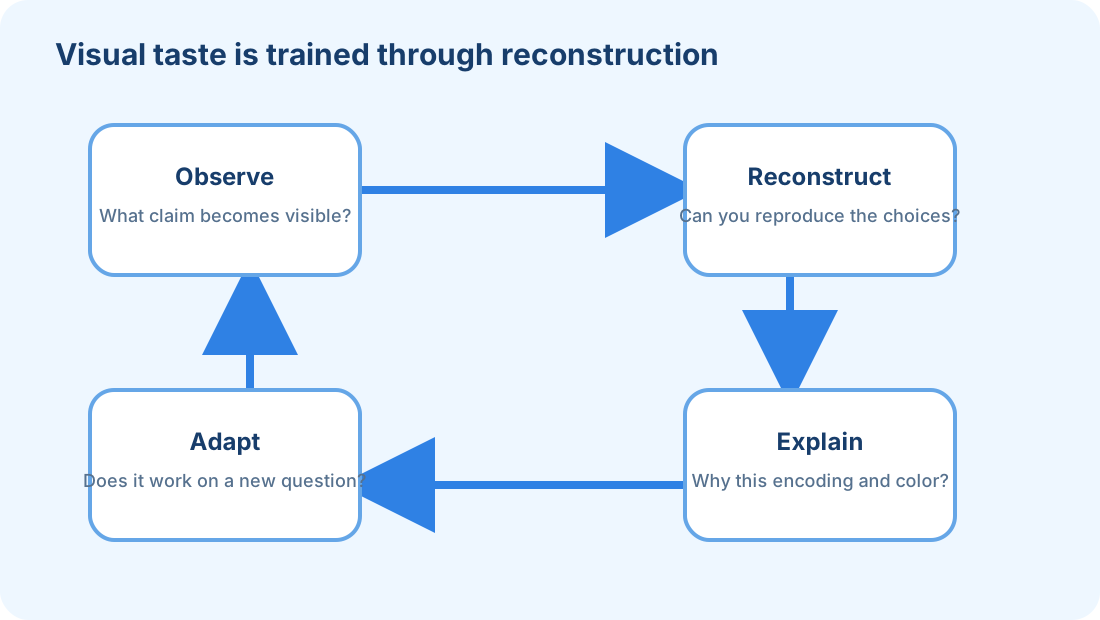
Each week, choose one figure you admire. Before touching code, write its claim in one sentence. Identify the data mapping, visual encoding, ordering, color logic, annotation, and caption. Recreate it with different toy data. Then change one design choice and explain whether the evidence becomes clearer or weaker. Save both the code and your explanation.
Suppose the original figure compares the waiting-time distributions of four staffing plans. It uses four overlapping histograms, and the caption claims that Plan D reduces both typical and extreme waits. Your first job is not to imitate its colors. Ask whether overlapping histograms allow the reader to see the tails. Perhaps a box plot hides distribution shape; perhaps an empirical cumulative distribution makes the probability of waiting longer than ten minutes immediately visible. The correct reconstruction begins from the claim.
Create a toy dataset with 200 waits per plan. Make the original histogram as faithfully as possible, then make a second version with aligned density panels or cumulative curves. Keep axis limits and sample sizes comparable. Add a vertical line at the operational threshold, not merely at the mean. If Plan D improves the median but produces a small dangerous tail, the threshold view exposes what the average concealed.
Now inspect design choices one by one. Order plans from baseline to proposed rather than alphabetically. Use one neutral color for baselines and one accent for the recommended plan. Avoid a rainbow when color carries no variable. Put units in the axis label. Write a caption that states the comparison, scenario, and message: “Across 200 simulated lunch periods under the +20% demand scenario, Plan D lowers the median wait but still exceeds the ten-minute target in 7% of runs.” The caption does not say “Plan D is clearly superior” unless the evidence and objective justify that sentence.
Reconstruction becomes powerful when you keep a gallery organized by purpose: distribution, trend, relationship, geography, network, uncertainty, sensitivity, and method comparison. When a contest requires a figure, search the claim category rather than browsing pretty examples at random. The next blog will develop these choices in depth; this practice gives you the visual vocabulary needed to benefit from it.
Do not panic if this feels unfamiliar. The next blog is devoted to visual evidence: how to select a chart, use color, annotate uncertainty, arrange multiple panels, and write captions. For now, the habit is enough—look carefully, rebuild often, and ask what the figure proves.
Extending the Algorithm Library
This course will introduce the central model families, but development takes time and no finite course can contain every method you may need. After each blog, learn one step beyond it. If we cover linear programming, explore integer decisions or dual interpretation. If we cover regression, compare regularization or robust loss. If we cover time series, investigate how one method handles seasonality or structural breaks.
The extension should be small enough to finish. Write a one-page Notion entry with the question the method answers, required inputs, output, assumptions, a tiny example, validation, failure modes, and a code link. Add one comparison with the baseline from class. This turns “I watched another tutorial” into knowledge your future team can retrieve.
Do not collect algorithms like trading cards. A method belongs in your library only when you can explain its contract and test it. Knowing ten ways to optimize without knowing how to define feasibility is not preparation. The useful question is: under what evidence would this method be more appropriate than the simpler one?
For example, after learning linear programming, take the classroom allocation baseline. Continuous variables might allow “0.4 of a room,” which is mathematically feasible but operationally absurd. Add integer variables and solve a tiny instance. Then ask what changed: the feasible set became discrete, the solution may be more expensive, and computational difficulty can grow. Record a relaxation bound and explain what it tells you. You have extended the method by following a real limitation, not by choosing a more impressive name.
After regression, replace squared error with absolute or Huber loss and add one outlier to a toy dataset. Predict the direction of the fitted line. Plot residuals and compare parameter stability. After shortest paths, add capacity and multiple commodities; observe that independently shortest routes can overload one edge. After deterministic optimization, perturb demand and compare nominal, scenario-based, and robust decisions. Each extension should have a visible reason.
Use a standard algorithm card:
- Question: What decision or estimate does the method answer?
- Contract: What are the input shape, output, objective, and constraints?
- Assumptions: Which mechanism or statistical condition matters?
- Baseline: What simpler method should it beat?
- Tiny case: What answer can you calculate by hand?
- Evidence: Which metric and split support it?
- Failure: What data or scenario makes it unreliable?
- Cost: What computation, tuning, or explanation burden does it create?
- Extension: Which single limitation will you address next?
When you teach the card to a teammate, do it without slides first. If you cannot describe why the method changes the decision, return to the tiny case. Put working code, a figure, and a one-paragraph interpretation beneath the card in Notion. Over months, this becomes a course that your team has built together—one tested extension after every formal blog.
AI-Assisted Modeling with ChatGPT
ChatGPT is most useful when you treat it as a fast, fallible collaborator. It can ask questions, explain methods, draft code, suggest tests, critique prose, and help organize a search. It cannot observe your physical system, guarantee a theorem, certify code, or create a legitimate citation merely by sounding confident. The team remains responsible for every submitted claim.
Begin with Context and a Contract
Do not start with “solve this problem.” Give the decision, audience, available data, constraints, current stage, and desired form of help. Then define boundaries: ask for questions or alternatives before asking for a solution; require assumptions to be labeled; require uncertainty and verification steps; prohibit invented data and sources.
A useful opening prompt is: “We need to recommend a staffing plan for a campus dining hall. We have timestamped arrivals, service durations by station, labor rules, and a budget. Before proposing a method, list the decisions, states, constraints, missing information, and three baselines. Separate facts from assumptions.” This prompt turns AI into a problem-structuring partner rather than a vending machine for algorithms.
Use AI for Divergence, Then Human Judgment for Convergence
Early in a project, ask for several formulations: a capacity balance, a queueing simulation, and a robust optimization extension. Request the assumptions and evidence each requires. This is divergence. Then the team selects a baseline using domain knowledge, time, data, and validation. Do not let the model choose merely because one answer is written more confidently.
Ask adversarial questions: “What observation would make this formulation inappropriate?” “Which variable is not available at decision time?” “Give a counterexample in which the recommended policy fails.” A good session should create tests, not only text.
Ask for Explanations at Several Levels
When a method is unfamiliar, ask for a plain-language mechanism, a small numerical example, the formal equations, and a failure case. Compare them. If the plain explanation says demand is conserved but the equations create customers, you found a contradiction. Ask the model to check units and limiting cases, but then perform those checks yourself.
Never cite an AI explanation as authority. Use it to identify concepts and search terms, then read textbooks, papers, or official documentation. If it names a theorem, verify the hypotheses. If it names a paper, open the real paper and confirm the title, authors, and claim.
Generate Code in Testable Pieces
Ask for functions with explicit inputs and outputs, not a 500-line notebook. Provide a toy case and expected result. Request assertions for dimensions, bounds, conservation, and feasibility. Run the code in your environment, read it, and compare against a baseline.
For data analysis, do not upload sensitive or restricted data without permission. Share a schema or synthetic sample when possible. Ask the model to explain every transformation. Keep raw data untouched and record which code came from AI so it can be reviewed carefully.
Use AI to Design Validation
This is one of its best roles. Describe the model and ask for unit tests, stress scenarios, ablations, sensitivity ranges, negative controls, and leakage checks. Then decide which tests are relevant. For a forecast, ask how to split time without using the future. For an optimizer, ask how parameter error might change feasibility. For a network metric, ask for graphs where the metric gives a misleading recommendation.
Let AI criticize a result before it helps polish the paragraph. Ask: “Assume this conclusion is wrong. Give five plausible causes, the observation each would produce, and the cheapest test.” That converts vague caution into an investigation plan.
Revise Writing Without Erasing Ownership
Give ChatGPT your reasoning and ask it to identify missing transitions, undefined symbols, unsupported claims, and sentences that confuse correlation with causation. Ask for two clearer alternatives, then edit them yourself. Do not ask it to manufacture an authoritative tone around weak evidence.
Keep your own voice and preserve technical precision. A polished paragraph must still match the actual code and figure. After revision, read every number, variable, and direction of change against the source result. Fluent prose can conceal a sign error more effectively than rough prose.
Verify Sources and Maintain an AI Log
For every factual claim, keep the real source, page, and access information. Never cite a URL you have not opened. Maintain a simple AI-use log with date, tool/model, purpose, prompt summary, output used, and human verification. This makes disclosure easier and helps teammates review AI-assisted work.
COMAP’s current rules permit responsible AI use but require open, honest disclosure, and its official AI policy gives reporting examples. Requirements can change, so read the current rules before each competition. CUMCM rules and university policies must be checked separately; permission in one contest does not automatically transfer to another.
Build Prompts from Modeling Roles
A prompt becomes more useful when it names the intellectual job to be done. “Help with Question 2” tells the model almost nothing. “Act as a skeptical operations-research reviewer; inspect whether our variables and constraints faithfully represent the dining-hall decision” defines a role, an object, and a standard of judgment. You are not pretending that the model is a certified reviewer. You are using the role to shape the kind of questions it asks.
For problem framing, provide the original wording and ask for a table with four columns: phrase from the prompt, mathematical meaning, information required, and ambiguity to resolve. Then inspect the table yourself. The model may interpret “capacity” as hourly flow while the stakeholder means simultaneous occupancy—the exact distinction we met at the ski resort. A helpful response exposes that ambiguity; an unhelpful response silently chooses one meaning.
For model design, provide your current contract and ask for three levels: a hand-checkable baseline, one extension addressing a named failure, and one deliberately excessive model. Request an explanation of what evidence would justify moving from one level to the next. This prevents the conversation from becoming a contest in mathematical ornamentation. If the baseline and extension recommend the same action throughout the observed range, the added complexity may not deserve space in the report.
For data work, share column names, units, a few synthetic rows, and what each row represents. Ask for an audit plan before asking for code. The plan should check identifiers, duplicates, time range, missingness, impossible values, inconsistent units, and leakage. Only after agreeing on those checks should you request small functions. Otherwise AI may produce elegant plots of a table whose rows were misunderstood.
For mathematical derivation, ask the model to declare assumptions, derive one step at a time, label every equation, check dimensions, and test a limiting case. Do not accept “therefore” as a proof. Reproduce the derivation on paper. Substitute simple values. If a probability leaves
For review, provide the draft together with the evidence it is supposed to describe. Ask the model to mark four things separately: unsupported factual claims, undefined notation, logical jumps, and style problems. Fix them in that order. A beautiful transition should not receive attention before a claim without evidence.
A Worked AI Session: Campus Cooling
Suppose a campus must decide which buildings to pre-cool before a hot afternoon. You have hourly outdoor temperature, building occupancy forecasts, electricity prices, and rough thermal-response estimates. The goal is to reduce peak electricity cost while keeping occupied rooms inside a comfort band. This is small enough to follow, but rich enough to show where AI helps and where it does not.
The first prompt should not ask for code. Give the story and ask: “List the decision variables, states, measured inputs, uncertain inputs, constraints, and outputs. Identify any word whose operational definition is missing.” A useful response may suggest that pre-cooling power is a decision; indoor temperature is a state; outdoor temperature and price are inputs; occupancy is uncertain; comfort and equipment power are constraints; and total cost and peak demand are outputs. It should also ask what “comfort” means, how often decisions can change, and whether the demand charge depends on the maximum fifteen-minute or hourly load.
Now the team resolves what it can. Suppose the facilities manager sets a
Next ask for a one-zone temperature recurrence such as
where
Ask AI for tests. A reasonable list includes zero-cooling behavior, constant-temperature equilibrium, maximum cooling, an empty building, forecast error, and a price spike. Add a synchronization test: if all buildings follow the same cheap hour, does aggregate power violate the peak objective? Run those cases. If the equation predicts that an uncooled building becomes colder than both its initial state and the outdoor air without another cooling mechanism, the recurrence or parameter fit is wrong.
Only then ask for optimization code. Specify array shapes, bounds, objective components, and a tiny two-building, three-hour instance. Require the function to return the schedule, temperature trajectories, total energy cost, and peak load separately. Compare the solver’s result with two baselines: no pre-cooling and naive cheapest-hour pre-cooling. If the optimization cost is lower only because the room violates comfort at an unreported half hour, the apparent improvement is not valid.
For writing, give ChatGPT the actual result table and ask it to draft a cautious paragraph. Then check every number and causal statement. “Pre-cooling caused a 14% reduction” is too strong if the evidence is only a simulation under assumed parameters. “Under the calibrated one-zone simulation, the schedule reduced the modeled peak by 14% relative to the stated baseline” is precise. The qualifiers are not weakness; they tell the reader what was actually demonstrated.
Finally ask for a hostile review: “Assume our recommendation fails during implementation. List plausible reasons and a measurement for diagnosing each.” Perhaps occupancy forecasts are wrong, thermal parameters drift, local thermostats override the schedule, or the hourly model misses fifteen-minute peaks. The team turns the useful items into limitations and a monitoring plan. In this session AI accelerated structure, code scaffolding, tests, and critique. The data, calibration, execution, and final claims remained ours.
Recognize Verification Debt
Every AI-generated item creates a verification obligation. A proposed variable needs a definition. A formula needs a derivation and unit check. Code needs tests. A factual claim needs a source. A citation needs to be opened. A rewritten paragraph needs comparison with the real result. Call this verification debt.
Debt is not automatically bad. Generating five baseline ideas in two minutes may be worth checking them. Producing fifty pages of unfamiliar code is usually not, because the team cannot inspect it before the deadline. Keep the size of each AI contribution within the team’s ability to verify. If nobody understands a module, it is not a shortcut; it is an unpriced risk.
Track status explicitly: suggested, checked, accepted, or rejected. An AI suggestion should not enter the report while still marked suggested. For important derivations or algorithms, require a second teammate to review the check. This is the same logic as code review, applied to all generated content.
Protect Privacy, Integrity, and Team Learning
Do not paste confidential, personally identifiable, licensed, or competition-restricted material into an external service without permission. Minimize data, anonymize when appropriate, and consult the applicable policy. A synthetic sample can often communicate the structure without exposing the real records.
Do not let one teammate become the private operator of a mysterious AI conversation. Save relevant prompts and decisions in the shared workspace so others can challenge them. If a result depends on a conversation nobody else can see, the workflow is not reproducible.
Most importantly, preserve learning. Before asking AI to explain a concept, write your own guess. Before accepting its derivation, try the first step. Before running generated code, predict the output of a tiny case. AI should shorten the feedback loop, not remove the moment when you form a model in your own head. The goal is not to finish one report while remaining dependent; it is to become the person who can recognize when the assistant is wrong.
Prompt Patterns for Common Competition Tasks
The following patterns are templates, not incantations. Replace the brackets with real context, and never paste a response directly into a paper. Their value is that they request artifacts you can inspect.
Problem audit. “We must [decision/prediction] for [stakeholder]. The prompt provides [data] and requires [deliverables]. Create a table of facts, decisions, states, parameters, constraints, uncertainty, and missing definitions. Quote the phrase that motivates each item. Do not propose an algorithm yet.” This is useful in the first reading because it slows the jump from nouns to methods. Check every quoted phrase against the actual prompt.
Baseline design. “Propose three baselines ordered by complexity. For each, state inputs, outputs, assumptions, a tiny hand-checkable example, validation, and one failure that would justify the next level. Prefer mechanisms that answer the decision over fashionable algorithms.” A good answer may include a naive policy, a transparent mathematical model, and a richer extension. Choose one; do not build all three simply because they were listed.
Assumption review. “Here is our assumption ledger [ledger]. For each assumption, identify its mathematical consequence, likely direction of bias, observable warning sign, and a sensitivity or field test. Prioritize assumptions that could reverse the recommendation.” This turns a decorative assumptions page into a test plan. Reject speculative bias directions that the model cannot justify.
Data audit. “Each row represents [entity/time]. Columns and units are [schema]. The decision occurs at [time]. Design checks for duplicates, missingness, impossible values, inconsistent units, leakage, drift, and sampling bias. Return checks as small functions with expected outputs on this synthetic sample [sample].” Run the functions and inspect flagged records; generated checks can themselves be wrong.
Equation review. “Review this derivation line by line. Do not replace it with a different model. Check algebra, units, sign, bounds, limiting cases, and whether each assumption supports the step. Give the first invalid line and a counterexample.” Asking for the first invalid line discourages a vague rewrite. Re-derive it independently after reading the critique.
Optimization formulation. “Separate sets, parameters, decisions, states, objective terms, and constraints. For every constraint, provide the real-world sentence it enforces and its unit. Construct one feasible and one infeasible tiny solution. Identify any nonlinear or integer element and explain its computational implication.” This helps catch constraints that look formal but do not represent an implementable rule.
Code generation. “Implement only [function]. Inputs have shapes [shapes], units [units], and constraints [constraints]. Return [outputs]. Include type hints, docstring, deterministic seed if relevant, and tests for [tiny cases]. Do not read or write files inside the function.” Small pure functions are easier to inspect. Integrate them only after their tests pass.
Debugging. “Expected [result], observed [result], minimal input [input], code [code], and environment [versions]. Generate hypotheses ordered by diagnostic value, and for each give one check that distinguishes it. Do not rewrite the entire program.” This keeps the model focused on diagnosis. Execute one distinguishing check at a time so you learn which mechanism failed.
Visualization review. “The claim is [claim], data fields are [fields], and audience is [audience]. Compare three encodings. For each, explain what the reader can and cannot infer, how uncertainty appears, and what misleading choice to avoid. Draft a caption containing scenario, sample, metric, and takeaway.” Build the chosen chart yourself and verify that the caption matches it.
Result interpretation. “Here are the verified outputs [table]. Write a plain-language interpretation that distinguishes observation, model output, causal claim, and recommendation. State the baseline and scenario. Do not invent reasons not supported by the model.” Search the draft for every number and adjective. Words such as substantial or stable need quantitative support.
Adversarial review. “Act as a skeptical judge. Given our model contract, evidence, and conclusion, list the five most consequential ways the conclusion could be wrong. For each, point to the exact unsupported step and propose the cheapest discriminating test. Do not criticize style until the evidence chain is addressed.” Some criticisms will be irrelevant; the team decides which could actually change the answer.
Paper consistency. “Given the variable table, equations, figure captions, and conclusion, report inconsistent symbols, units, scenario names, numerical values, and causal language. Return locations and suggested checks, not rewritten prose.” This is especially helpful late in the contest, but it does not replace page-by-page human review.
Use a two-pass conversation. In the first pass, ask for questions, risks, and alternatives. In the second, after the team makes decisions, ask for a bounded artifact. Long conversational threads accumulate stale assumptions, so restate the current contract when it changes. If the assistant keeps using an abandoned definition, start a clean thread with the approved facts.
Evaluate prompts by the quality of the resulting checks, not by the elegance of the response. A short prompt that reveals target leakage is better than an elaborate persona that produces ten pages of generic advice. Save only the patterns that repeatedly improve your work, and attach an example of when each failed.
A Complete AI Workflow
Use this sequence for each module:
- Frame: the team writes the decision, inputs, outputs, and constraints.
- Question: AI identifies ambiguity, missing data, and alternative baselines.
- Choose: the team selects a formulation and records why.
- Implement: AI may draft a small function or test; a teammate reviews it.
- Verify: compare with hand calculations, baselines, held-out data, and stress cases.
- Interpret: the team explains the result in domain language.
- Critique: AI searches for counterexamples and unsupported claims.
- Document: record sources, decisions, code versions, and AI use.
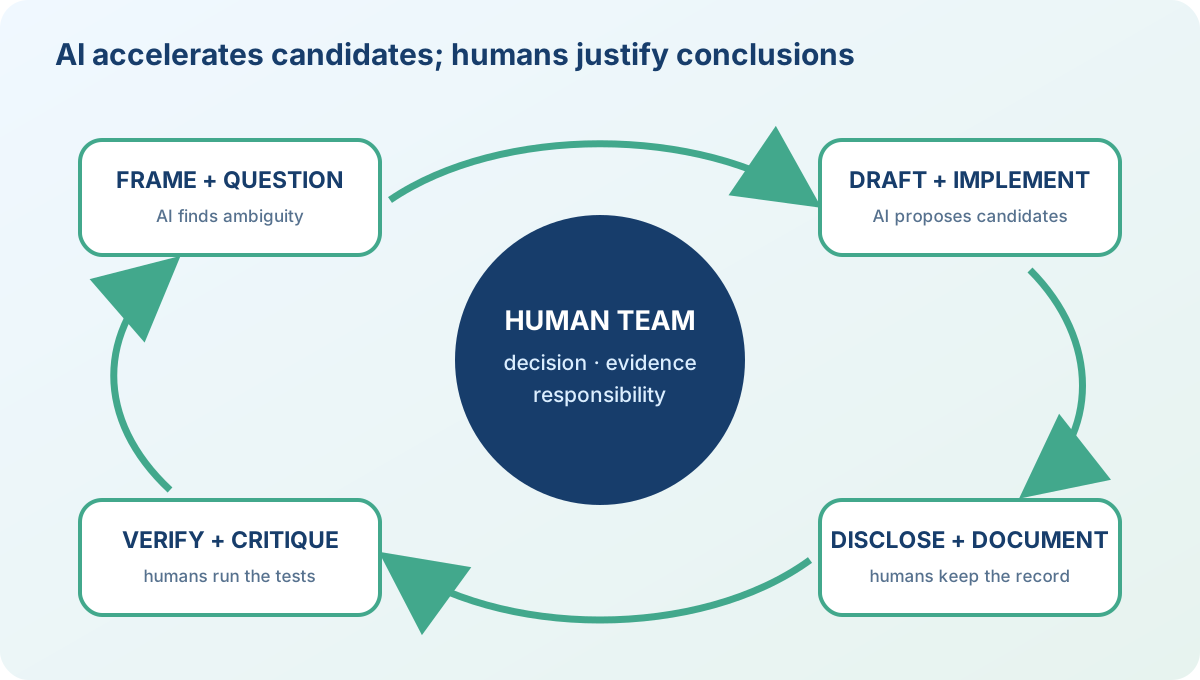
The rule underneath every step is simple: AI may accelerate the path from a question to a candidate answer; it may not shorten the path from a candidate answer to justified evidence. If an output saves twenty minutes of typing but requires forty minutes of verification, that may still be worthwhile—but count the verification as part of the method.
Competition-Day Execution and Quality Gates
A practiced workflow still needs checkpoints. Without them, a team can work intensely for two days and discover on the final morning that its strongest model answers a different question from the prompt. Use a short review at every major transition. A review is not a meeting in which everyone reports how busy they are. It asks whether a concrete artifact is ready to become an input to the next stage.
The first gate is the problem contract. Before serious modeling begins, one teammate should be able to point to a page containing the decision, system boundary, variables with units, outputs, constraints, evaluation criteria, and unresolved ambiguities. Read each requested task aloud and map it to a future section, result, or recommendation. If a sentence in the prompt has no destination, the plan is incomplete. If a planned model has no requested task, it may be an attractive distraction.
The second gate is the baseline result. Require one end-to-end result early, even if it is deliberately simple. A mean forecast, greedy route, linear heat balance, equal-weight score, or deterministic queue may be enough. The baseline must run on actual inputs, produce an interpretable output, and answer at least part of the question. Record its limitations rather than apologizing for them. Later methods earn their place by correcting one named weakness or changing one consequential decision.
The third gate is numerical trust. Select a tiny example and verify at least one intermediate value by hand. Check units, signs, dimensions, bounds, conservation, and limiting behavior. For data models, audit row counts before and after every transformation and inspect whether features would exist at decision time. For optimization, test both a known feasible decision and a deliberately infeasible one. For simulation, confirm that impossible events never occur and that repeated runs show the expected variation. This gate should happen before the team invests in beautiful plots.
The fourth gate is comparative evidence. A result without a reference point is difficult to judge. Compare the proposed method with the baseline, observed data, an alternative scenario, or a known special case. Report both improvement and cost. If prediction error falls by two percent but runtime grows by a factor of fifty and the final recommendation remains unchanged, the elaborate method may belong in a short robustness note rather than at the center of the paper. If a small parameter change flips the decision, sensitivity is not a decorative appendix; it is part of the answer.
The fifth gate is the communication chain. Place every important figure beside the paragraph whose claim it supports. Read the caption without looking at the main text: it should identify the scenario, variables, units, comparison, and takeaway. Trace every major number in the conclusion back to a table, figure, or calculation. Search for language such as optimal, robust, significant, realistic, and accurate. Ask what test or definition licenses each word. Remove any adjective that is stronger than the evidence.
Imagine a team studying emergency water delivery after a storm. Its baseline sends each vehicle to the nearest unmet demand. A mixed-integer model then reduces estimated total travel time by 12 percent. That headline is not ready. At the numerical gate, the team discovers that travel times were treated as symmetric even though several roads are one-way. After correction, the improvement is 7 percent. At the comparative gate, a stress scenario closes two bridges; the optimized plan becomes brittle, while a slightly longer route retains access to every shelter. At the communication gate, the team replaces “our optimal plan is robust” with a precise recommendation: under normal access, Plan A cuts estimated travel time by 7 percent; when either bridge is unavailable, Plan B preserves full coverage with a 4 percent normal-time penalty. The gates did not weaken the paper. They turned a fragile claim into a decision a reader can use.
Assign one teammate as the temporary owner of each gate, but rotate the role. The author of a module is often least able to see its unstated assumptions. A reviewer should reproduce the command that generates the result, inspect the input and output, and ask one counterfactual question. “What if demand is 20 percent higher?” is useful only when the answer can be computed or bounded. Review comments should end with an action: run a scenario, clarify a definition, compare a baseline, or narrow a claim.
Reserve the final hours for integration rather than invention. Freeze model structure at a pre-agreed time unless a verified error makes the result invalid. Regenerate all figures from the current data and code, update cross-references, inspect the PDF on another computer, and check the official submission rules. Confirm page limits, file names, anonymization, references, appendix contents, and required AI disclosure. Open the final file after export; do not assume that successful compilation means readable equations, embedded fonts, or uncropped figures.
Finally, keep a short incident log during the contest. Record failures that cost time: an overwritten dataset, an inconsistent unit, a chart rebuilt manually, a prompt that produced invented citations, or a late change that broke three sections. After submission, convert each recurring incident into a preventive habit, test, template, or folder rule. Competition technique matures when painful surprises become routine checks.
Integrated Preparation Routine
Do not turn this blog into a rigid daily timetable. Build a repeatable weekly loop instead. Read one strong paper and make a paper card. Reconstruct one figure and explain its claim. Extend one algorithm from the course with a tiny tested example. Put the notes, code, and limitations in the shared workspace. Once a month, choose one old problem and complete a small end-to-end submission under a time limit.
After the practice, conduct a postmortem. Which decision consumed the most time? Which handoff broke? Which figure failed to support its claim? Which AI output was useful, and which created verification debt? Convert each answer into one change to the team workflow. Improvement comes from closing this loop, not from collecting more bookmarks.
The first blog taught us to build a modeling contract. Competition technique is the art of preserving that contract under pressure. Choose the problem by its evidence path, give each tool one job, learn from strong work without copying it, rebuild the visuals that sharpen your judgment, extend methods beyond class, and use AI as a critic and assistant rather than an oracle. Then, when the clock starts, your team is not beginning from zero; it is executing a system it has already practiced.
There is a small easter egg hidden in this blog’s advice: the best “competition trick” is not a trick at all. Open an old problem, set a ninety-minute timer, and stop exactly when it rings. The artifact on your screen—especially what is still missing—will tell you more honestly than any self-assessment which part of your team system needs practice.
Official References
- Title: 2 - Competition Techniques
- Author: Gavin0576
- Created at : 2026-09-19 00:00:00
- Updated at : 2026-10-23 07:06:57
- Link: https://jiangpf2022.github.io/blog//2026/09/19/Mathematical-Modeling-02-Competition-Techniques/
- License: This work is licensed under CC BY-NC-SA 4.0.